Phytoplankton Physiology
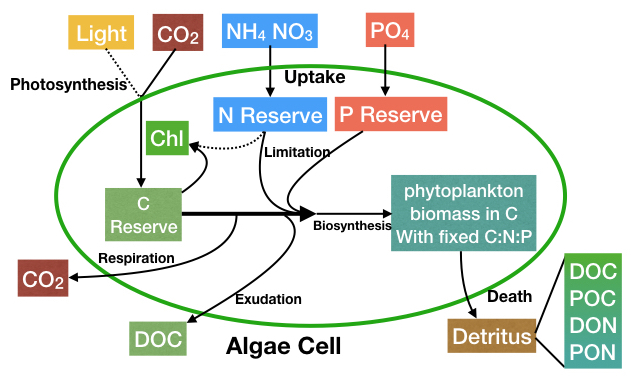
The various resources and processes are summarized in the schematic below, and further detail is provided in the following sub-sections.
State Variables
Each phytoplankton individual is characterized using eight state variables (see table below).
| Symbol | Unit | Description |
|---|---|---|
| Bm | $mmol~C/cell$ | functional biomass pool in C |
| Cq | $mmol~C/cell$ | C reserve |
| Nq | $mmol~N/cell$ | N reserve |
| Pq | $mmol~P/cell$ | P reserve |
| chl | $mg~Chl/cell$ | Chla pool |
| Sz | $unitless$ | relative cell size |
| gen | $unitless$ | generation |
| age | $hour$ | age of the individual |
Photosynthesis
The parameterization for photosynthesis is formulated as
\[PS=PC \cdot Bm\]
\[PC=PC_{max}\cdot (1-e^{\frac{-\alpha\Phi \cdot I\cdot Chl}{PC_{max}\cdot Bm}})\]
\[PC_{max}= PCmax \cdot Sz^{PC_b}\]
where $PS$ is cell-specific light limited photosynthesis rate ($mmol~C~cell^{-1}~s^{-1}$). $PC$ is carbon-specific light limited photosynthesis rate ($mmol~C~(mmol~C)^{-1}~s^{-1}$). $PC_{max}$ is light-saturated photosynthesis rate ($mmol~C~(mmol~C)^{-1}~s^{-1})$ and is scaled by a power-law relationship of cell size ($Sz$), $I$ is the flux of photosynthetically active radiation (PAR, $\mu mol~photons~m^{-2}~s^{-1}$).
Nutrient Uptake
Nutrient uptake rates ($VNH4$, $VNO3$, and $VPO4$) are cell-specific ($mmol~N~cell^{-1}~s^{-1}$ or $mmol~P~cell^{-1}~s^{-1}$) and include intracellular nutrient limitation (Droop limitation):
\[\begin{align} VNH4 &= VNH4_{cell}\cdot regQ_N\cdot\frac{[NH4]}{[NH4]+K_{NH4}^{sat}} \nonumber \\ VNO3 &= VNO3_{cell}\cdot regQ_N\cdot\frac{[NO3]}{[NO3]+K_{NO3}^{sat}} \nonumber \\ VPO4 &= VPO4_{cell}\cdot regQ_P\cdot\frac{[PO4]}{[PO4]+K_{PO4}^{sat}} \nonumber \end{align}\]
\[\begin{align} regQ_N &= \bigg[\frac{Nqmax-Q_N}{Nqmax - Nqmin}\bigg]_0^1 \nonumber \\ regQ_P &= \bigg[\frac{Pqmax-Q_P}{Pqmax - Pqmin}\bigg]_0^1 \nonumber \end{align}\]
\[\begin{align} Q_N &= (Nq + Bm \cdot R_{NC}) / (Cq + Bm) \nonumber \\ Q_P &= (Pq + Bm \cdot R_{PC}) / (Cq + Bm) \nonumber \end{align}\]
\[\begin{align} VNH4_{cell} &= VNH4max \cdot Sz^{VN_b} \cdot Bm \nonumber \\ VNO3_{cell} &= VNO3max \cdot Sz^{VN_b} \cdot Bm \nonumber \\ VPO4_{cell} &= VPO4max \cdot Sz^{VP_b} \cdot Bm \nonumber \end{align}\]
where $VNH4max$, $VNO3max$, and $VPO4max$ are constant parameters (see Parameters) while $VNH4_{cell}$, $VNO3_{cell}$, and $VPO4_{cell}$ are cell-specific maximum uptake rates ($mmol~N~cell^{-1}~s^{-1}$ or $mmol~P~cell^{-1}~s^{-1}$) depending on cell size, $Sz$.
Reserve Update
The model first updates C, N, and P reserves based on photosynthesis rate ($PS$) and nutrient uptake rates ($VNH4$, $VNO3$, and $VPO4$) as formulated above. The result is then used to calculate the biosynthesis and excretion rates.
\[\begin{align} Cq &= Cq+PS \cdot \Delta T \nonumber \\ Nq &= Nq+(VNO3+VNH4) \cdot \Delta T \nonumber \\ Pq &= Pq+VPO4 \cdot \Delta T \nonumber \end{align}\]
Biosynthesis And Excretion Rates
Potential biosynthesis rates are calculated based on C, N, P quotas as
\[\begin{align} BS_C &= Cq \cdot k_{mtb} \nonumber \\ BS_N &= Nq/R_{NC} \cdot k_{mtb} \nonumber \\ BS_P &= Pq/R_{PC} \cdot k_{mtb} \nonumber \end{align}\]
\[k_{mtb}= kmtb_{max} \cdot Sz^{kmtb_b}\]
The minimum of these rates gives the actual biosynthesis rate, $BS$ ($mmol~C~cell^{-1}~s^{-1}$), and the difference between carbon-based biosynthesis rate and $BS$ gives the excretion rate, $ExuC$ ($mmol~C~cell^{-1}~s^{-1}$).
\[BS = min(BS_C, BS_N, BS_P)\]
\[ExuC = BS_C - BS\]
Chlorophyll Synthesis
\[S_{chl} = \rho_{chl} * BS * R_{NC}\]
\[\begin{equation} \rho_{chl} = \begin{cases} chl:N * \frac{PC*Bm}{\alpha I \cdot chl}, & \quad \alpha I > 0,\\ 0 & \quad else. \end{cases} \nonumber \end{equation}\]
Respiration
\[Respir = respir_a \cdot Sz^{respir_b} \cdot Bm\]
Biomass Update
Biosynthesis yields a biomass increase, a commensurate reduction in nutrient reserves, and an increase in chlorophyll. The carbon reserve is further modified by respiration.
\[\begin{align} Bm &= Bm + BS \cdot \Delta T \nonumber \\ Cq &= Cq - (BS - Respir) \cdot \Delta T \nonumber \\ Nq &= Nq - BS*R_{NC} \cdot \Delta T \nonumber \\ Pq &= Pq - BS*R_{PC} \cdot \Delta T \nonumber \\ chl &= chl + S_{chl} \cdot \Delta T \nonumber \end{align}\]
Cell division
Relative cell size, $Sz$, is used to indicate cell division. Cells will not divide if $Sz<2.0$ and the probability of individual cell division ($P_D$) is then given by a sigmoidal function of $Sz$ with different cell division strategies.
\[Sz = (Bm + Cq) / Cquota\]
\[P_D = rand(Bernoulli(P_{dvid}*S_{dvid}))\]
where $S_{dvid}$ represents the sigmoidal function in different cell division strategies (listed below) and $P_D$ is computed every 10 min (when model time step is smaller than 10 min) or every time step (when model time step is larger than 10 min).
Sizer
The probability of cell division is a function of cell size and increases as the cell size gets larger.
\[S_{dvid} = tanh(stp_D * (Sz - reg_D)) + 1.0\]
Adder
The probability of cell division is a function of the difference between current cell size and initial cell size ($iSz$) and increases as the difference gets larger.
\[S_{dvid} = tanh(stp_D * (Sz - iSz - reg_D)) + 1.0\]
Timer
The probability of cell division is a function of clock time and increases in the dark.
\[S_{dvid} = tanh(stp_D * (t - reg_D)) + 1.0\]
Sizer+Timer
The probability of cell division is a multiplication of a function of clock time and a function of cell size.
\[S_{dvid} = (tanh(stp1_D * (Sz - reg1_D)) + 1.0) * (tanh(stp2_D * (t - reg2_D)) + 1.0)\]
Adder+Timer
The probability of cell division is a multiplication of a function of clock time and a function of the difference of current cell size and initial cell size.
\[S_{dvid} = (tanh(stp1_D * (Sz - iSz - reg1_D)) + 1.0) * (tanh(stp2_D * (t - reg2_D)) + 1.0)\]
$stp1_D$, $reg1_D$, $stp2_D$, and $reg2_D$ may be different for different cell division strategies.
Grazing
For now, the model does not have individuals of grazers. Instead, a quadratic grazing term is parameterized and implemented in the model to represent the grazing loss of cells. For each individual, the probability to be grazed ($P_G$) is calculated as below.
\[P_G = P_{graz} * pop\]
where pop is the number of individuals in the grid cell where the individual stays.
Parameters
| Symbol | Param | Default | Unit | Description |
|---|---|---|---|---|
| $Cquota$ | Cquota | 1.8e-11 | $mmol~C~cell^{-1}$ | carbon quota when $Sz = 1.0$ |
| $PCmax$ | PCmax | 4.2e-5 | $s^{-1}$ | Maximum photosynthesis rate |
| $\alpha$ | $\alpha$ | 2.0e-2 | $m^2~mgChl^{-1}$ | Irradiance absorption coeff |
| $\Phi$ | $\Phi$ | 4.0e-5 | $mmol~C~ / \mu mol~photons$ | Maximum quantum yield |
| $VNH4max$ | VNH4max | 6.9e-6 | $s^{-1}$ | Maximum ammonium uptake rate |
| $VNO3max$ | VNO3max | 6.9e-6 | $s^{-1}$ | Maximum nitrate uptake rate |
| $VPO4max$ | VPO4max | 1.2e-6 | $s^{-1}$ | Maximum phosphate uptake rate |
| $PC_b$ | PC_b | 0.6 | Shape parameter for PC | |
| $VN_b$ | VN_b | 0.6 | Shape parameter for VNH4 and VNO3 | |
| $VP_b$ | VP_b | 0.6 | Shape parameter for VPO4 | |
| $K^{sat}_{NH4}$ | ksatNH4 | 0.005 | $mmol~N/m^3$ | Half-saturation constant for NH4 |
| $K^{sat}_{NO3}$ | ksatNO3 | 0.010 | $mmol~N/m^3$ | Half-saturation constant for NO3 |
| $K^{sat}_{PO4}$ | ksatPO4 | 0.003 | $mmol~P/m^3$ | Half-saturation constant for PO4 |
| $Nqmax$ | Nqmax | 0.12 | $mmol~N/mmol~C$ | Maximum N quota in cell |
| $Nqmin$ | Nqmin | 0.05 | $mmol~N/mmol~C$ | Minimum N quota in cell |
| $Pqmax$ | Pqmax | 0.01 | $mmol~P/mmol~C$ | Maximum P quota in cell |
| $Pqmin$ | Pqmax | 0.004 | $mmol~P/mmol~C$ | Minimum P quota in cell |
| $R_{NC}$ | R_NC | 16/106 | $mmol~N/mmol~C$ | N:C ratio in function biomass |
| $R_{PC}$ | R_PC | 1/106 | $mmol~P/mmol~C$ | P:C ratio in function biomass |
| $kmtb_{max}$ | k_mtb | 3.5e-5 | $s^{-1}$ | Maximum metabolic rate |
| $kmtb_b$ | k_mtb_b | 0.25 | Shape parameter for k_mtb | |
| $respir_a$ | respir_a | 1.2e-6 | $s^{-1}$ | Maximum respiration rate |
| $respir_b$ | respir_b | 0.6 | Shape parameter for respir_a | |
| $chl\text{:}N$ | Chl2N | 3.0 | $mg~chl/mmol~N$ | Maximum Chl:N in cell |
| $P_{dvid}$ | P_dvid | 5.0e-5 | $s^{-1}$ | Probability of division per second |
| $stp1_D$ | dvid_stp | 6.0 | Steepness of division function | |
| $reg1_D$ | dvid_reg | 1.9 | Regulation of division function | |
| $stp2_D$ | dvid_stp2 | 2.0 | Steepness of division function | |
| $reg2_D$ | dvid_reg2 | 12.0 | Regulation of division function | |
| $P_{graz}$ | P_graz | 0.0 | $s^{-1}$ | Probability of grazing per second |